


Table of Contents
- What Is Casino Analytics?
- Why Casino Analytics Matters More in 2026
- Core Casino KPIs Every Operator Should Track
- Player Retention Analytics: From Cohorts to Churn Prevention
- Revenue Growth: Connecting GGR, NGR, LTV, and Bonus ROI
- Game Performance Analytics and Content Mix Optimization
- Real-Time Casino Analytics and the Data Stack Behind It
- Predictive Analytics and AI in Casinos
- Fraud, Responsible Gambling, and Compliance Analytics
- How to Build a Casino Analytics Dashboard
- Common Casino Analytics Mistakes to Avoid
- Conclusion
- FAQ
Every casino operator knows that data should guide the business. The harder question is what to watch and what to change. The answer lies in casino analytics: a decision-making system that connects operational data across the business instead of reducing analysis to reports on deposits and GGR.
Without connected records, each casino team sees only one fragment of the player journey. This guide separates useful signals from noise. It explains which metrics matter, how retention analysis supports revenue decisions, and where operators commonly misread the numbers. We also cover dashboards, real-time data, AI, game performance, and governance.
What Is Casino Analytics?
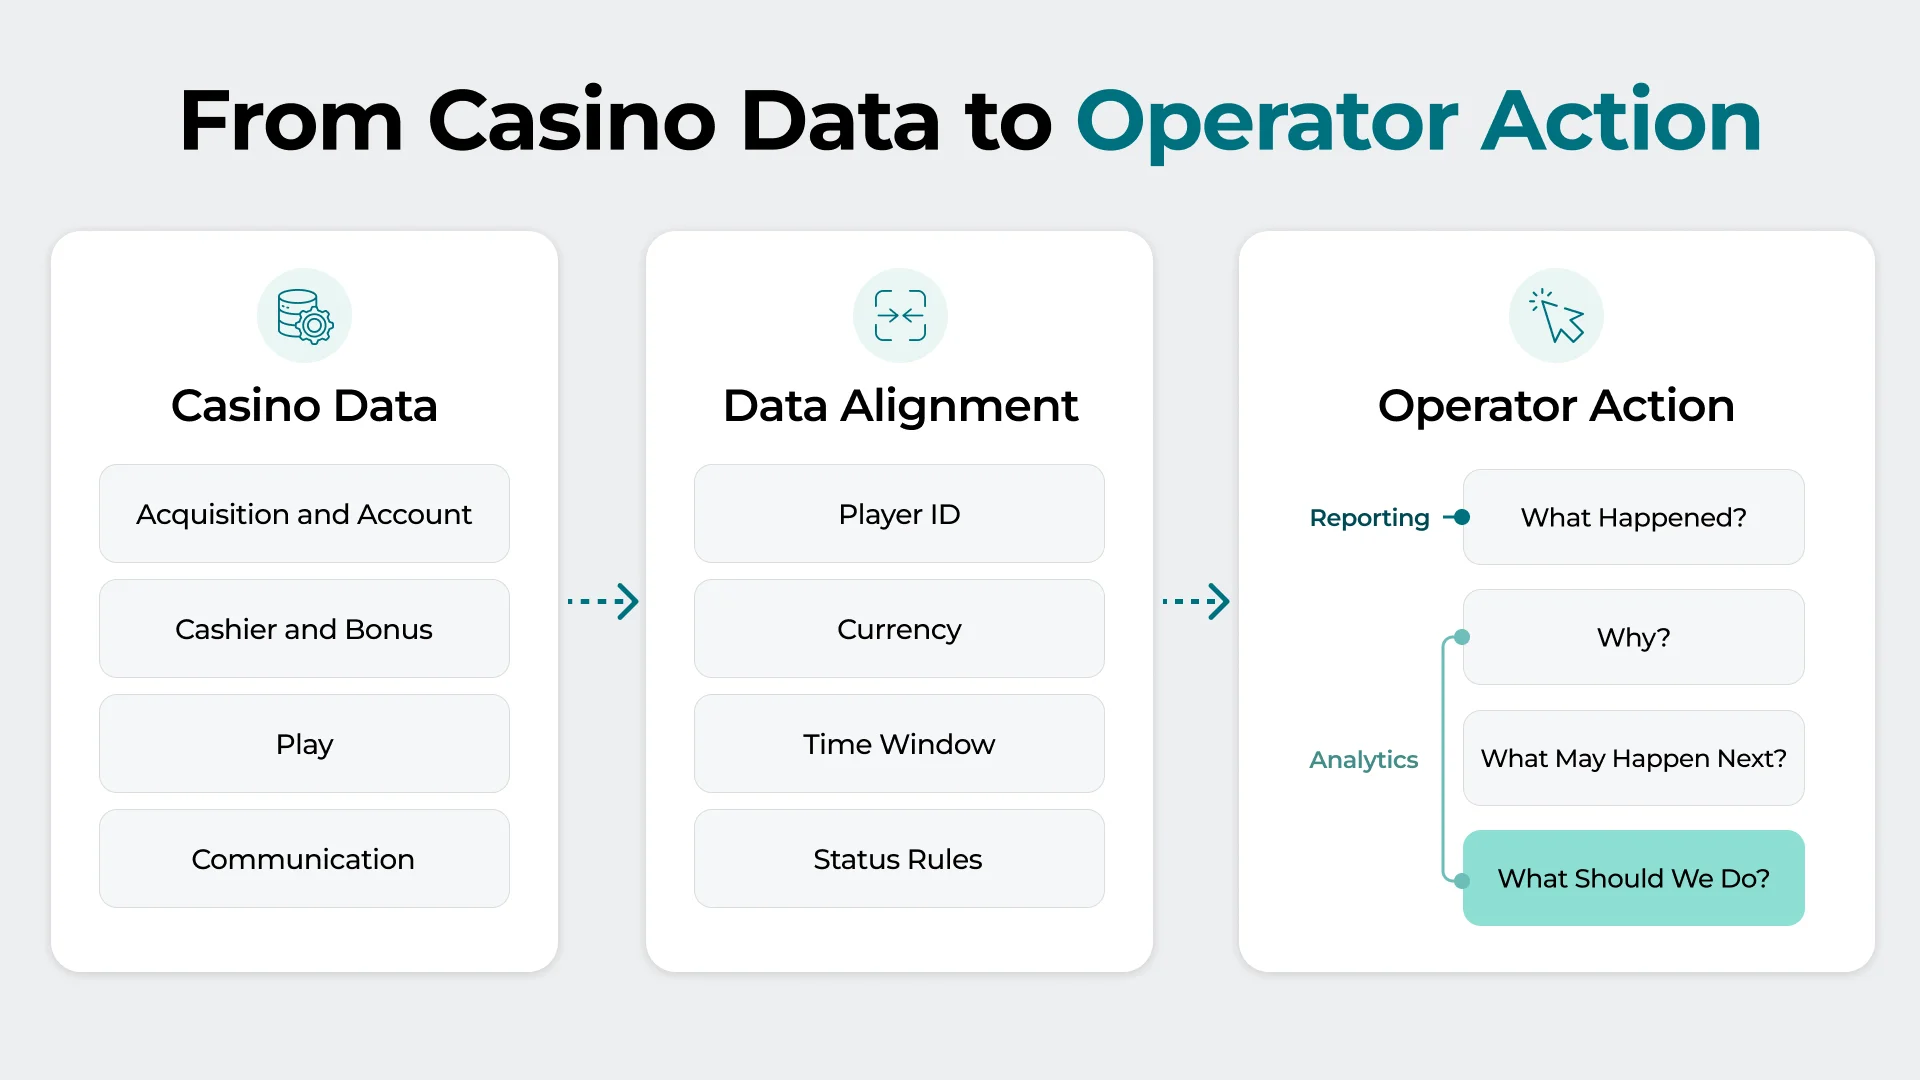
Casino analytics is the process of collecting, connecting, and interpreting data that reflects the business as a whole. By relating player behavior and game performance to financial, marketing, and operational results, it supports better decisions. Reporting shows what happened, while analytics explains why, anticipates what may happen next, and identifies the appropriate response.
The source trail covers four operational areas.
- Acquisition and account: affiliate and other acquisition data, registrations, KYC outcomes, and AML/RG flags.
- Cashier and bonus: payment events, including deposits and withdrawals, plus bonus activations.
- Play: game sessions, bet/win events, and RTP/game data.
- Communication: CRM campaigns and support tickets.
These records become useful when player IDs, currency logic, time windows, and status rules are consistent across systems. Then casino data analytics can trace a campaign click to long-term value and expose where a healthy-looking funnel loses margin, retention, or trust.
Why Casino Analytics Matters More in 2026
Acquisition remains expensive, catalogs are crowded, and players move between products and brands quickly. They also expect a more relevant and personalized experience that responds to their habits and preferences. At the same time, stricter compliance raises the cost of mistakes.
As you add provider integrations, content performance becomes harder to compare; each new market adds its own regulatory context.
In 2026, three principles matter:
- use connected analysis to separate traffic volume from acquisition quality and activity from retention;
- compare popular games with titles that drive repeat play, then relate revenue to margin;
- check whether gains survive bonus costs and whether patterns signal bonus abuse or compliance risk.
For multi-product brands, iGaming analytics connects casino and sportsbook activity at player level. Operators can see which product attracts the customer, when cross-product play begins, and whether it improves retention or commercial value.
Core Casino KPIs Every Operator Should Track
A KPI shows whether the casino is meeting a defined objective and helps determine the next action. For a complete operating view, casino KPIs should cover four layers: revenue and cash flow, acquisition and player value, retention and lifecycle movement, and the results and risks associated with bonuses and games.
Revenue and Cash Flow
Revenue analysis starts with turnover, the total amount wagered. GGR converts this volume into a revenue baseline by subtracting player winnings from stakes. NGR goes one step further and reflects the margin after operator-defined deductions.
These deductions usually include bonuses and taxes, while some formulas also account for provider fees and payment costs. Since the calculation varies between operators, finance and BI teams should ensure they use a common documented formula.
Cash-flow analysis covers deposits and withdrawals. Payment success rate and failed-deposit data reveal friction at the cashier, while retries show whether players eventually complete the transaction. Processing and payout times provide further insight into payment behavior and liquidity needs.
Acquisition and Player Value
Acquisition analysis moves from reach to activation. Registrations show how many people enter the funnel; active players show how many complete a defined action within the reporting period. FTDs mark the first successful real-money deposit.
An important distinction concerns "new depositing players." Some dashboards use the term as a synonym for FTD; others count only players who both register and deposit within the selected period. The latter suits same-period conversion analysis. FTD anchors lifecycle cohorts regardless of registration date.
Once activation is defined, compare cost per FTD and CAC with LTV based on cumulative NGR or contribution margin over a fixed window. LTV:CAC shows value relative to cost, while payback period shows how quickly the spend is recovered. Both guide channel budgets and reinvestment.
ARPU and ARPPU show average revenue per active player and paying player, respectively. Average deposit size and frequency explain funding behavior. For commercial value, use NGR or contribution margin per player; cohort LTV shows how it develops over time.
Retention and Lifecycle Movement
After activation, retention analysis follows how player activity changes over time. D1, D7, D30, D60, and D90 are retention checkpoints: each shows the percentage of a defined cohort that returns 1, 7, 30, 60, or 90 days after the starting event. Together, they reveal when the sharpest decline occurs.
The return event should match the decision. A login captures re-entry, a deposit shows renewed funding, and a real-money bet confirms resumed play. Keeping each time series tied to one event makes comparisons reliable.
The retention curve also provides a basis for setting inactivity rules. Dormancy can mark the earlier stage for re-engagement, while churn marks a later threshold for win-back planning. Set both around normal product cadence, because casino and sportsbook activity may follow different rhythms.
Reactivation rate then measures the share of inactive players who resume the chosen valuable action after contact. Compare it across inactivity stages to identify when players remain responsive and choose the right timing for win-back campaigns.
Bonuses, Games, and Risk
Bonus performance is measured from cost and wagering completion through to repeat deposits and post-campaign retention. Bonus ROI compares campaign cost with incremental NGR or contribution margin measured against a baseline or holdout group. Abuse indicators flag potentially exploitative activity.
Game analysis combines turnover, sessions, GGR contribution, and repeat play by title and category. It reveals where demand and revenue are concentrated, informing lobby placement, content mix, and provider selection.
Actual RTP is prizes divided by turnover; theoretical RTP is the game's designed long-term return. Hold is GGR divided by turnover and, under the same stakes and prizes, equals 100% minus actual RTP.
Self-exclusions, RG alerts, and deposit-limit changes indicate player-protection activity. Their growth may reflect higher player risk, wider use of protection tools, or more sensitive detection. AML metrics cover flagged cases, review times, resolutions, and escalations.
Player Retention Analytics: From Cohorts to Churn Prevention
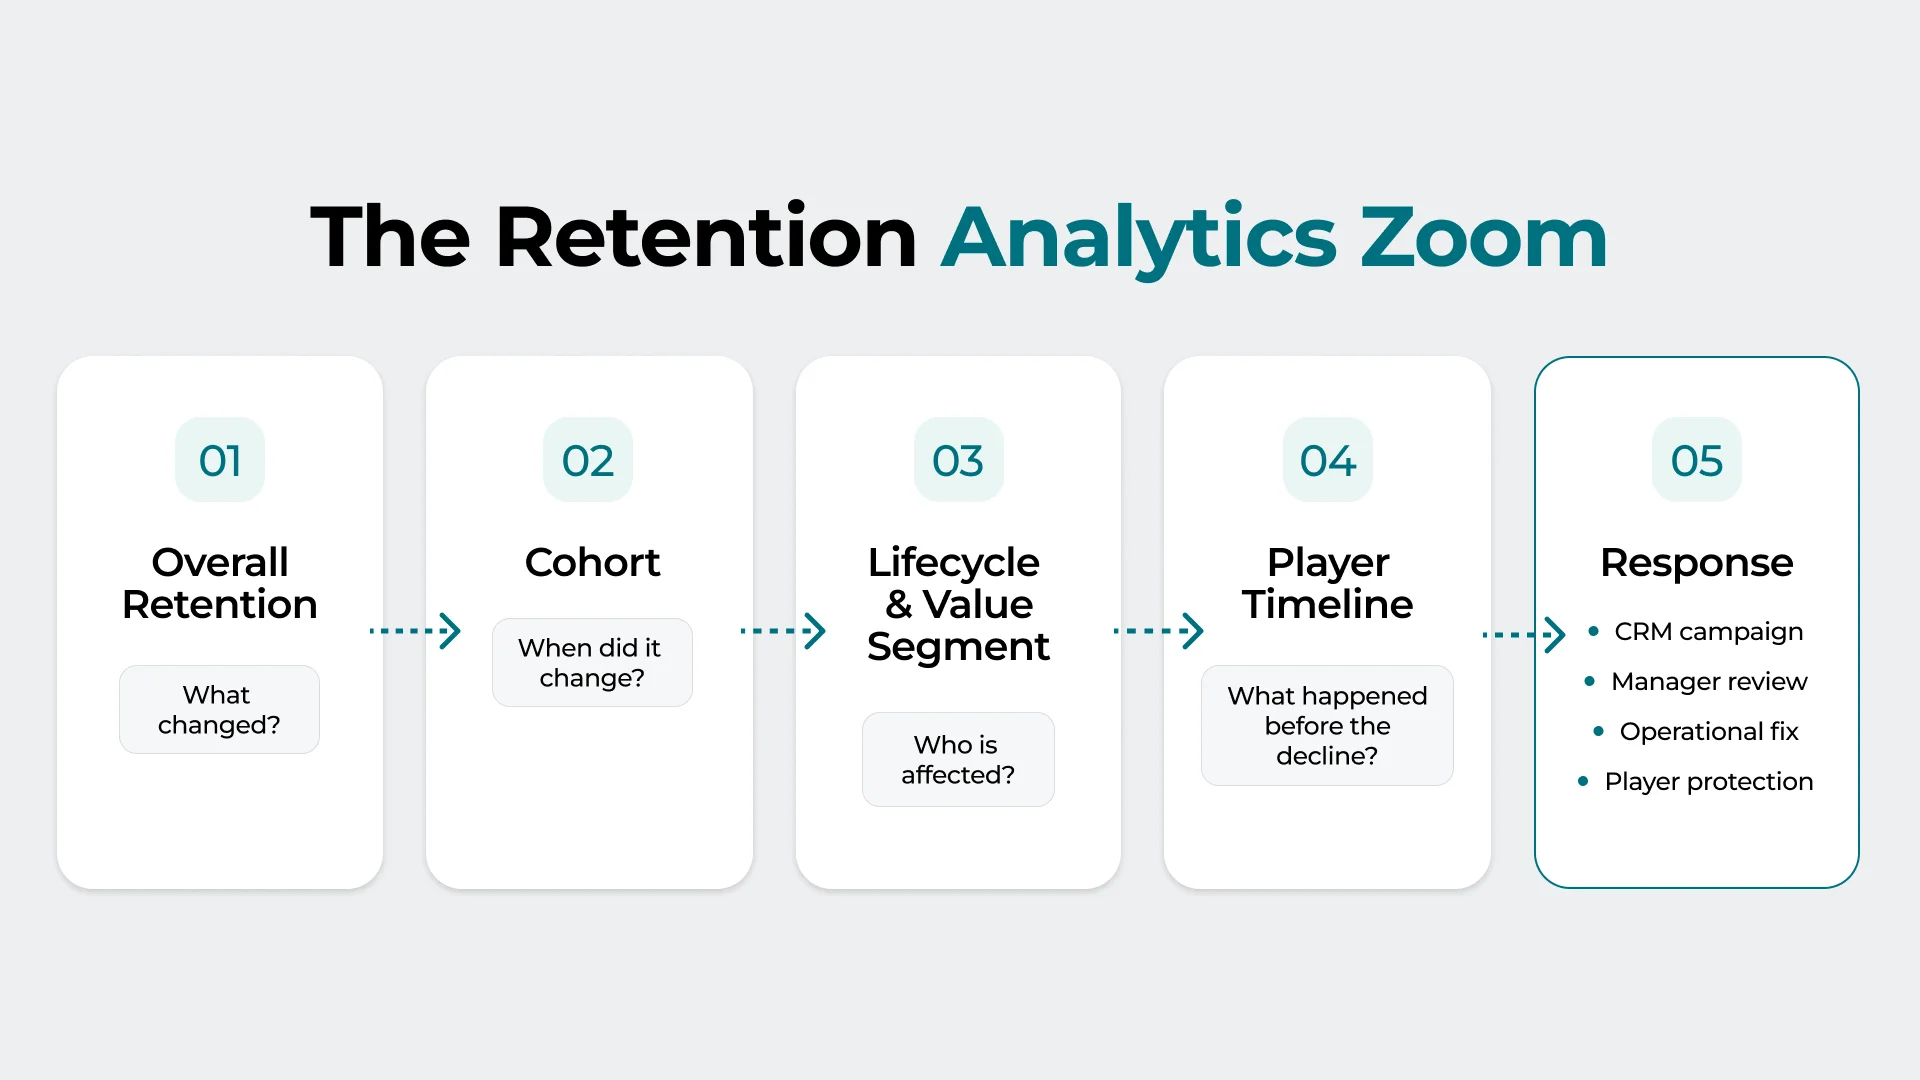
Player retention analytics turns retention metrics into an operating workflow. Cohort analysis identifies when return frequency weakens. Lifecycle segmentation locates the decline within the player journey, while value tiers show whether VIP or mid-value groups are affected. Next come the churn-risk triggers: they flag cases while reactivation is still viable.
Depending on the operator's objectives and available data, retention analysis can explore questions such as:
- Which acquisition channels bring players who still deposit after 30 days?
- Which cohorts generate positive NGR after bonus costs?
- Which players show declining session or deposit frequency, and how long is their reactivation window?
- Which VIP or mid-value segments are slipping into dormancy and may require CRM intervention?
Different players can show the same short-term decline, but its meaning depends on their lifecycle stage. Campaign history shows what a new depositor or regular player received before activity fell. Payment failures and support records may reveal operational friction. A VIP case may need manager review, while an RG signal requires player-protection review.
SoftGamings' CRM supports player segmentation and stores contacts and communication history. It also allows a manager to be assigned to an individual player. This context helps coordinate follow-up. Campaign objectives and segment definitions must remain consistent; so must the test design.
Revenue Growth: Connecting GGR, NGR, LTV, and Bonus ROI
Revenue growth is impossible without understanding its quality. Casino revenue analytics separates activity growth from profitable growth: deposits or turnover can rise while high bonus costs, bonus abuse, or weak NGR reduces the value that remains.
The gap between GGR and NGR shows how much of the gross result remains after the deductions in your documented formula. For regulatory returns in Great Britain, a related measure is used: gross gambling yield (GGY).
According to the UK Gambling Commission's guidance, GGY covers stakes and other related receipts less prizes or winnings. Withdrawals are not a separate component, so track the withdrawal-to-deposit ratio in a parallel cash-flow view.
LTV indicates whether the value of an acquired cohort justifies its cost; payback period adds the time required to recover that spend.
Bonus ROI should be compared by offer, segment, and lifecycle stage before you scale a campaign. Portfolio averages can hide an incentive that adds incremental NGR in one cohort while reducing it in another.
Player segment profitability should shape how you allocate acquisition and retention spend. Compare NGR per player with revenue per registration by cohort or source to see where durable value is concentrated.
Payment success rate shows what share of deposit attempts reaches a playable balance. A decline limits the activity that can generate GGR, even when acquisition remains stable.
Margin by game category reveals which parts of the lobby support profitable growth after relevant content costs. It is better to compare categories under one cost definition before changing lobby placement or the supplier mix.
Game Performance Analytics and Content Mix Optimization
Game performance analytics turns casino data into portfolio-management decisions. Turnover measures betting activity, while each title's GGR and NGR contribution makes its commercial role visible.
Player-response metrics capture different dimensions: unique players indicate reach, while session count shows frequency. Session depth and repeat play reveal continued use; retention after first play shows whether interest lasts.
Operators need to compare slots, live casino, and table games by market and segment. Jackpot titles are tracked separately across relevant categories. Provider-level results show how performance is distributed across suppliers.
Some titles attract a first session; others support regular play or peak during a short campaign. That's why experienced online casino operators match lobby placement to the observed role.
Treat short-sample RTP deviations with caution. According to the UK Gambling Commission's guidance, actual RTP should be assessed against theoretical RTP in light of play volume and volatility. One deviation does not establish a fault.
Once that context is clear, read the RTP gap alongside financial contribution and player behavior. Then compare each result by provider and category within the relevant market.
For game-level NGR, document how bonuses and supplier fees are allocated. This helps keep title comparisons consistent under your chosen formula.
A broad casino games integration gives you more titles to test across markets. Use portfolio contribution to choose which titles merit lobby visibility or CRM support and which should move to a less prominent position. Name recognition will be your assistant at this stage.
Real-Time Casino Analytics and the Data Stack Behind It
Real-time casino analytics processes selected events quickly enough for an operational response. It can surface failed deposits or sudden revenue drops within seconds or minutes.
Risk teams use real-time signals to investigate suspicious behavior and bonus abuse, while marketing teams act on churn indicators and changes in campaign performance.
Historical analysis is a different matter. It rarely requires an immediate response, so cohort retention and final campaign profitability can usually be analyzed through scheduled processing.
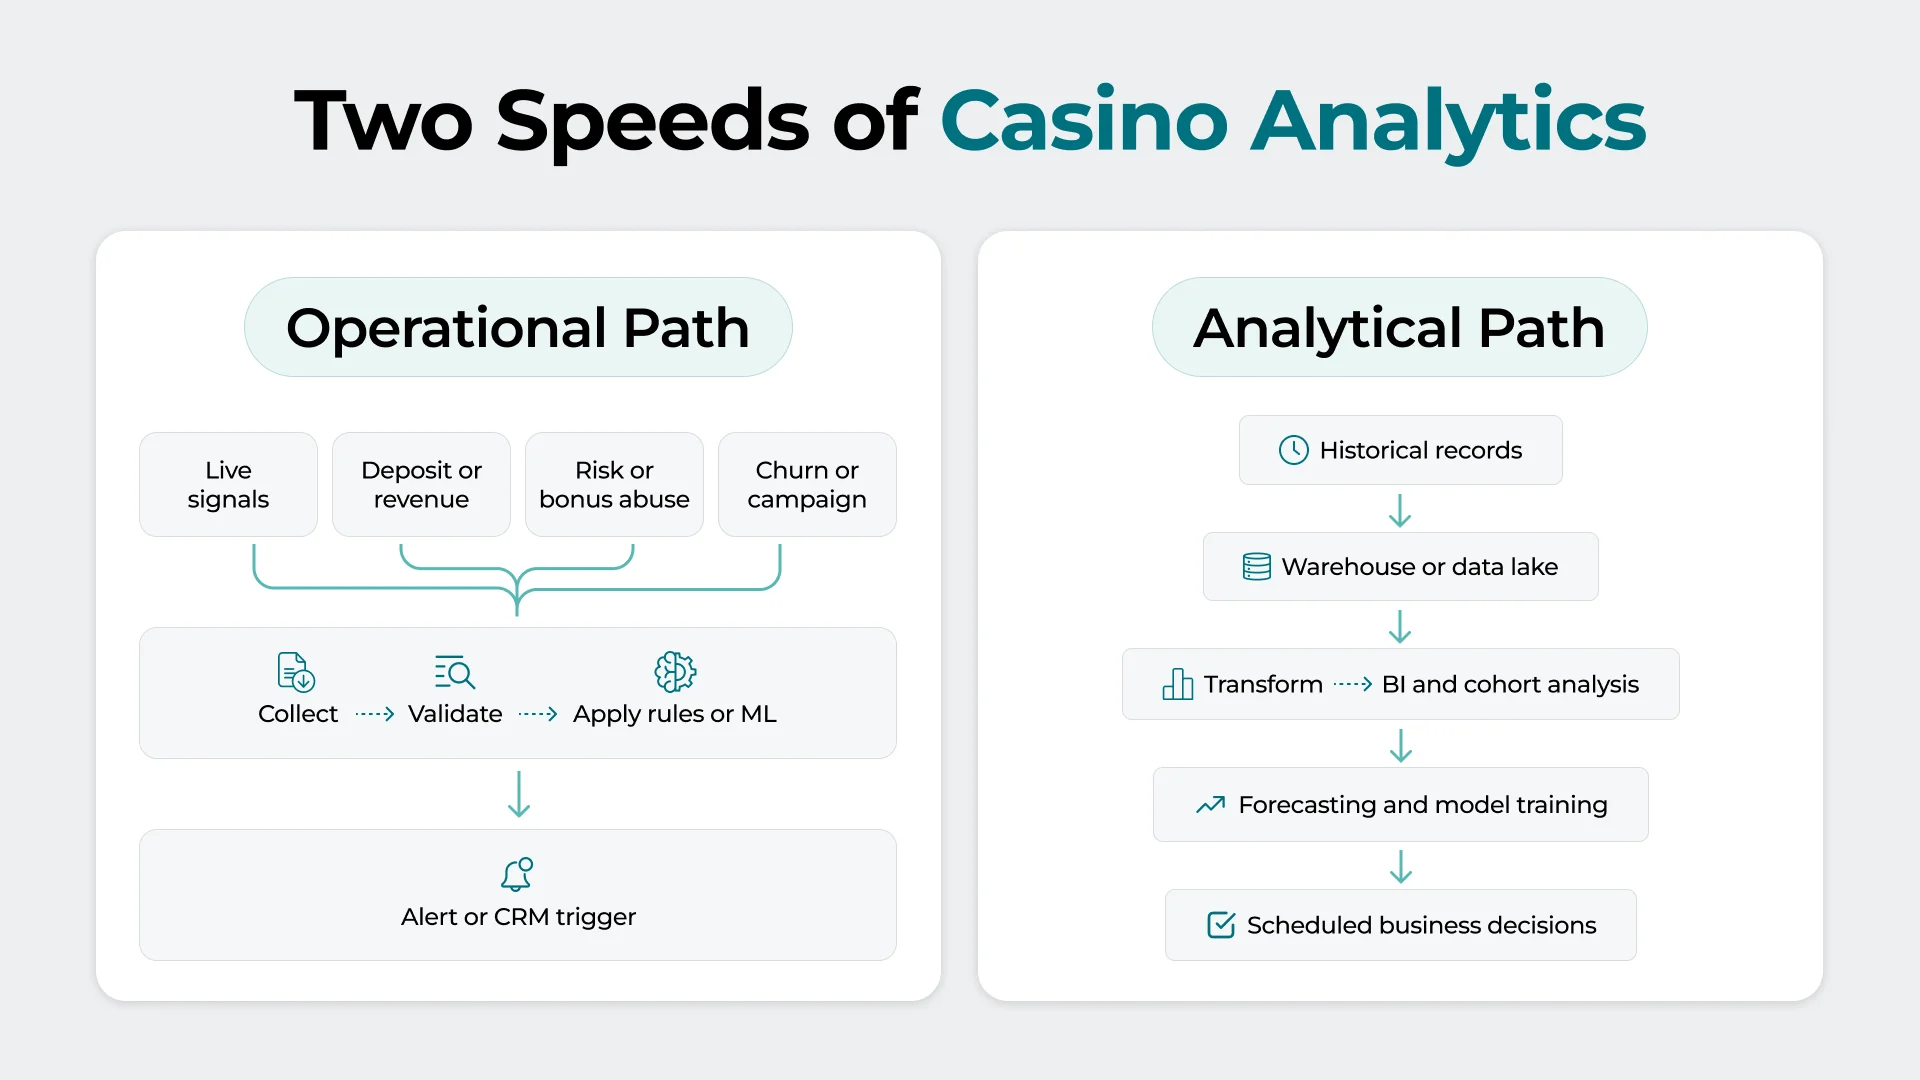
Before building an alert or dashboard, define the required data and maximum delay. Decide who will use the tool, who owns the response, and what action follows each signal. Add an escalation path where needed. Otherwise, the bottleneck can move from data collection to decision-making.
For each analytics use case, verify event coverage and the data contract, then test latency. This is why the API layer matters: it carries data and actions between tools through a single connection. SoftGamings' casino API links 300+ game providers and 150+ payment solutions in one integration, bringing their data into one analytical environment.
Predictive Analytics and AI in Casinos
Predictive analytics in casinos uses statistical or AI/ML models to estimate likely outcomes from historical and current data. Operators can apply it in four areas.
- Retention and value: predict churn and LTV, then update dynamic segments as behavior changes.
- Content: forecast game demand and personalize game recommendations for eligible players.
- Financial and integrity risk: assess payment risk; use anomaly detection to flag suspected bonus abuse or fraud.
- Player protection: detect responsible gambling risk signals for timely action.
CRM teams can use churn scores, while risk analysts review payment and anomaly flags.
Track accuracy and false positives, then monitor drift and outcomes by segment. Bias in training data or shifts in behavior can block legitimate customers or misclassify risk, creating potential reputational harm.
Keep accountability with the relevant teams. AI should support decisions while compliance checks, responsible gambling processes, and human review remain in place.
Fraud, Responsible Gambling, and Compliance Analytics
Fraud analytics flags multi-accounting, collusion, and bonus abuse by connecting account activity with payment and betting data. Suspicious transaction patterns may include payment anomalies or repeated chargebacks, while unusual betting patterns can require a separate integrity review.
AML monitoring serves a different purpose: it covers financial crime risk, case handling, and the submission of required reports.
Responsible gambling analytics uses RG alerts to identify signs of possible harm. These may include changes in play or spend and the use of gambling-management tools, such as deposit-limit adjustments or cooling-off requests. Use them to select a timely and proportionate response. Route self-exclusion through the procedure required in the relevant jurisdiction.
Some signals can trigger more than one workflow. A sharp rise in spending, for example, may require both AML and responsible gambling review. Set separate thresholds, access rights, and procedures for each function. To make everything work out, audit trails should record the evidence reviewed, the decision made, and the time of any intervention.
Configure jurisdiction-specific reporting around the competent authority, required data, and submission deadlines. Protection indicators should measure control performance and player safety. Keep commercial targets out of self-exclusion and protective-intervention workflows. This framework does not constitute legal advice, so verify the requirements in every target market.
How to Build a Casino Analytics Dashboard
The best way to organize a dashboard is to build it around the decisions each role makes. Keep the first screen to regular measures and context behind movement.
✓ Executive
Show GGR and NGR as revenue measures, with deposits presented separately as cash flow. Then add margin, LTV, CAC, payback, and cohort retention. Let leaders trace changes to player volume, activity, product mix, or VIP concentration before acting.
✓ CRM and retention
Use cohorts for retention and churn risk. Add segment migration and campaign response, then link bonus ROI to incremental NGR. Connect bonus system events to CRM and financial data. After activation, track wagering and repeat deposits, then assess retention and cost. Send abuse indicators to risk.
✓ Product and game
Compare performance and contribution at game, category, and provider levels. Track sessions and revenue per player. Read actual RTP alongside the corresponding hold, using sufficient play volume. Use launch success and repeat play to assess adoption; apply market preferences when tailoring the portfolio by GEO.
✓ Finance
Reconcile turnover with GGR and NGR, while separating deposits from withdrawals. Monitor payment costs, success rates, and reconciliation status.
✓ Risk and compliance
Prioritize fraud alerts and payment anomalies. Show AML and RG indicators, including self-exclusions, with the evidence, owner, and case status.
✓ Support and operations
Track payment failures and funnel drop-offs together because both affect conversion. Show support load separately. Monitor technical health through uptime, latency, and game errors.
For every metric, document its definition and source. Set the refresh schedule, assign an owner, and state what follows a threshold breach or alert. This turns casino KPIs into operational business intelligence: the dashboard provides shared facts, while ownership triggers a suitable response.
When evaluating casino analytics software, check analysis and governance. Users should be able to drill into cohorts and segments, customize reports, and reconcile financial definitions. Also verify role-based access, data exports and lineage, plus alert routing to CRM or case-management workflows.
Reports & Analytics can extend the dashboard with custom business reports and queries: use selected criteria to build player segments, investigate risk, and prepare targeted bonuses or campaigns.
Common Casino Analytics Mistakes to Avoid
Analytics mistakes can be costly for operators. Their impact reaches from wasted acquisition and bonus spend to weaker game portfolio decisions and a slower response to risk signals.
Based on practical experience, we recommend avoiding the following mistakes.
- Treating bonus redemption as success. Calculate bonus ROI using incremental NGR and campaign cost; monitor redemption patterns for abuse.
- Ranking games only by popularity or turnover. Check sample size, margin, and repeat play before changing the mix.
- Calling a dashboard "analytics" before assigning a decision, owner, and response workflow.
- Using AI predictions before governance is in place. Retain human review and apply market-specific compliance requirements.
Disconnected tools separate CRM and payment records from game activity and risk flags. Link them through consistent player IDs.
Before comparing performance, align metric definitions across teams. Compare activity with player value and overall averages with cohort results. Validate predictions against outcomes, connecting each alert to a documented response.
Conclusion
Strong casino analytics turns historical data into timely action. It reveals when retention needs attention and gives operators a firmer basis for revenue and game-mix decisions. Earlier risk detection supports safer operations and growth built on reliable economics.
If you plan to launch or scale an online casino with SoftGamings, define analytics requirements when shaping the casino platform architecture. Provider integrations must supply the right events. CRM workflows and bonus systems should preserve the relevant history, while the reporting setup turns it into decision-ready information.
FAQ
What Is Casino Analytics?
Casino analytics examines player behavior and game performance through data. Revenue and payment records show financial results; bonus and marketing data explain campaign outcomes; risk signals guide control decisions. This evidence improves casino operations and business choices.
What Is a Casino Analytics Job Description?
A casino data analyst connects player behavior and campaign performance with revenue trends and CRM outcomes. The role also assesses slots and other game categories. Depending on the team, it may cover data pipelines, dashboards, and forecasts.
What Are the 4 Types of Analytics?
Descriptive analytics shows what happened, such as a fall in D30 retention. Diagnostic analytics investigates the cause across GEOs, channels, or payment methods. Predictive analytics estimates what may happen next. Prescriptive analytics recommends an action, such as reallocating campaign spend.
What Is the Best AI for Casino Prediction?
There is no reliable AI for predicting wins in certified RNG games because the next outcome must remain unpredictable. Such player-facing forecasts are outside the scope of this article. Here, AI serves operators by predicting churn and LTV, segmenting players, recommending games, detecting suspected bonus abuse, and monitoring risk.
What Is the $20 Method at the Casino?
The $20 method, often called the $20 trick, refers to offering a tip at a Las Vegas hotel check-in while asking whether a complimentary room upgrade is available. It is a player-facing travel practice and has no connection to operator analytics.
What Should Casino Analytics Software Include?
It needs role-based dashboards with cohort tracking and CRM segmentation. Reporting should cover games, bonus ROI, and payments, with support for custom reports and integrations. Governance requires access controls and consistent definitions; fraud and RG alerts must route into case review.
How Does Casino Analytics Improve Player Retention?
It improves retention by showing valuable cohorts and changes in session or deposit frequency. Compare these signals by lifecycle stage and check campaign response by segment. Then act within the relevant reactivation window, before players reach the inactivity threshold.