


Table of Contents
- Why More Data Does Not Automatically Mean More Insight
- Where iGaming Profitability Analysis Begins
- How Acquisition KPIs Track the Path to the First Deposit
- Measuring Engagement and Retention Beyond Averages
- Payment KPIs: Revenue, Friction, and Trust
- What Product, Bonus, and CRM KPIs Reveal About Value
- How Risk, Compliance, and Service KPIs Protect Growth
- Build a KPI System That Leads to Action
iGaming businesses generate an abundance of data, from impressions and registrations to wagers, withdrawals, and risk events. The difficult part is deciding which numbers deserve attention and what action should follow when they move.
A useful KPI system connects player behaviour to unit economics and risk. It shows:
- how efficiently traffic becomes depositing activity;
- how that activity develops over time;
- how much sustainable value remains after direct costs.
The platform matters because it brings these signals into one operating view. For example, the SoftGamings back office combines player data, payments, content, CRM, loyalty, and reporting so that teams can investigate performance across the journey rather than through isolated spreadsheets.
Why More Data Does Not Automatically Mean More Insight
A metric reports an event, while a KPI measures progress toward a business objective. Registrations are a metric. The registration-to-first-deposit rate becomes a KPI when the objective is to improve acquisition quality. It still needs a defined denominator, period, currency, and player-status rule.
This discipline prevents several common mistakes. Deposits are cash flow, not revenue. Turnover shows betting volume, not profitability. A lower CPA is valuable only if the acquired cohorts produce enough lifetime value.
Every dashboard should start with a decision: what would the team do differently if this number crossed its threshold? Without an answer, the metric belongs in an exploratory report, not the executive scorecard.
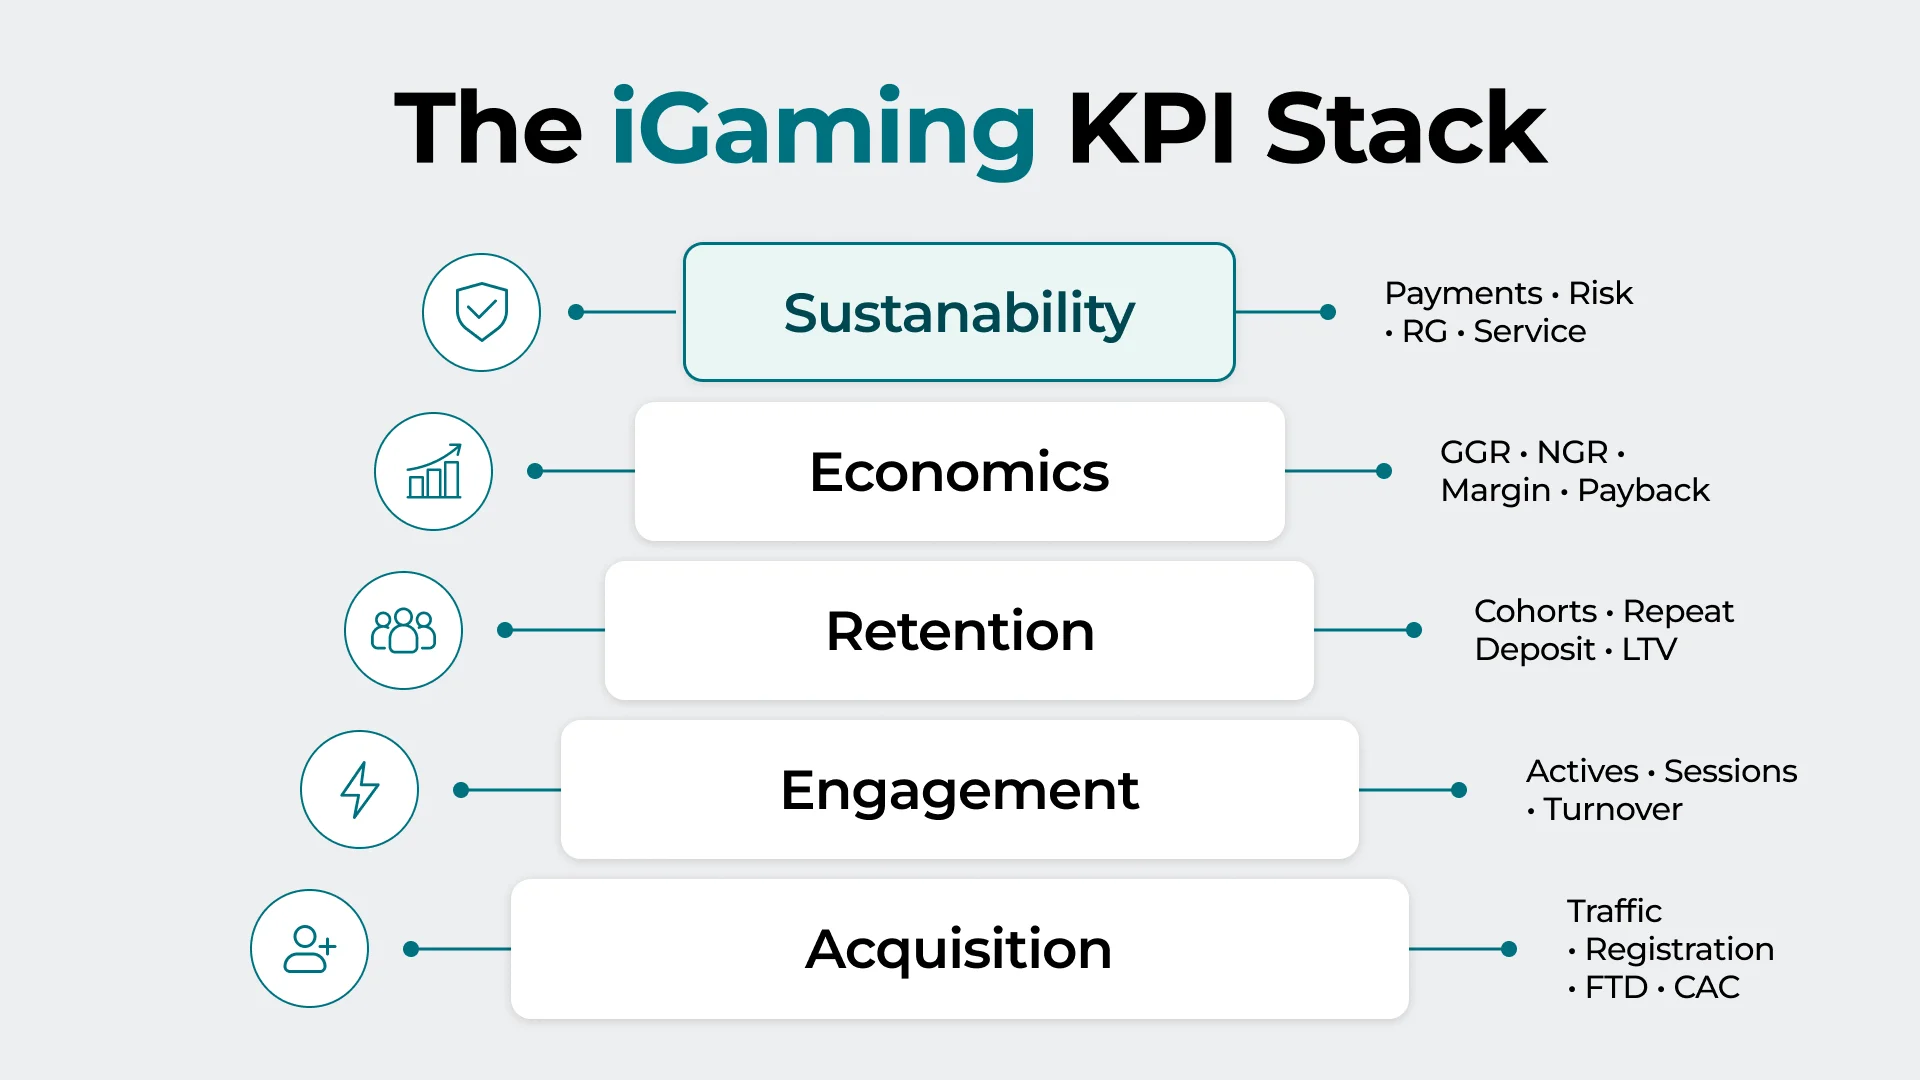
The online casino KPI stack includes five connected layers: from acquisition to sustainable value. Together, they show how performance at each stage affects the overall health of the iGaming business.
Where iGaming Profitability Analysis Begins
The clearest financial sequence is turnover → gross gaming revenue (GGR) → net gaming revenue (NGR).
Turnover is the total amount wagered, while GGR is stakes minus player winnings. Actual hold, calculated as GGR divided by turnover, helps explain how betting volume becomes gross revenue, although short-term results can fluctuate around the theoretical house edge (100% minus RTP) for casino games or the expected sportsbook margin.
NGR goes further by deducting agreed items such as bonuses, gaming taxes, provider fees, payment costs, and other direct adjustments. Because contracts and jurisdictions define these deductions differently, every operator needs one documented formula. Otherwise, finance, CRM, and affiliate teams may each report a valid-looking but different NGR.
Read the chain in absolute and per-player terms. NGR per active, ARPU, ARPPU, average stake, bets per active, and product share reveal whether growth comes from a broader base, higher activity, or a few VIPs. Add VIP share of GGR or NGR and deposit-to-withdrawal balance to expose concentration and liquidity risk.
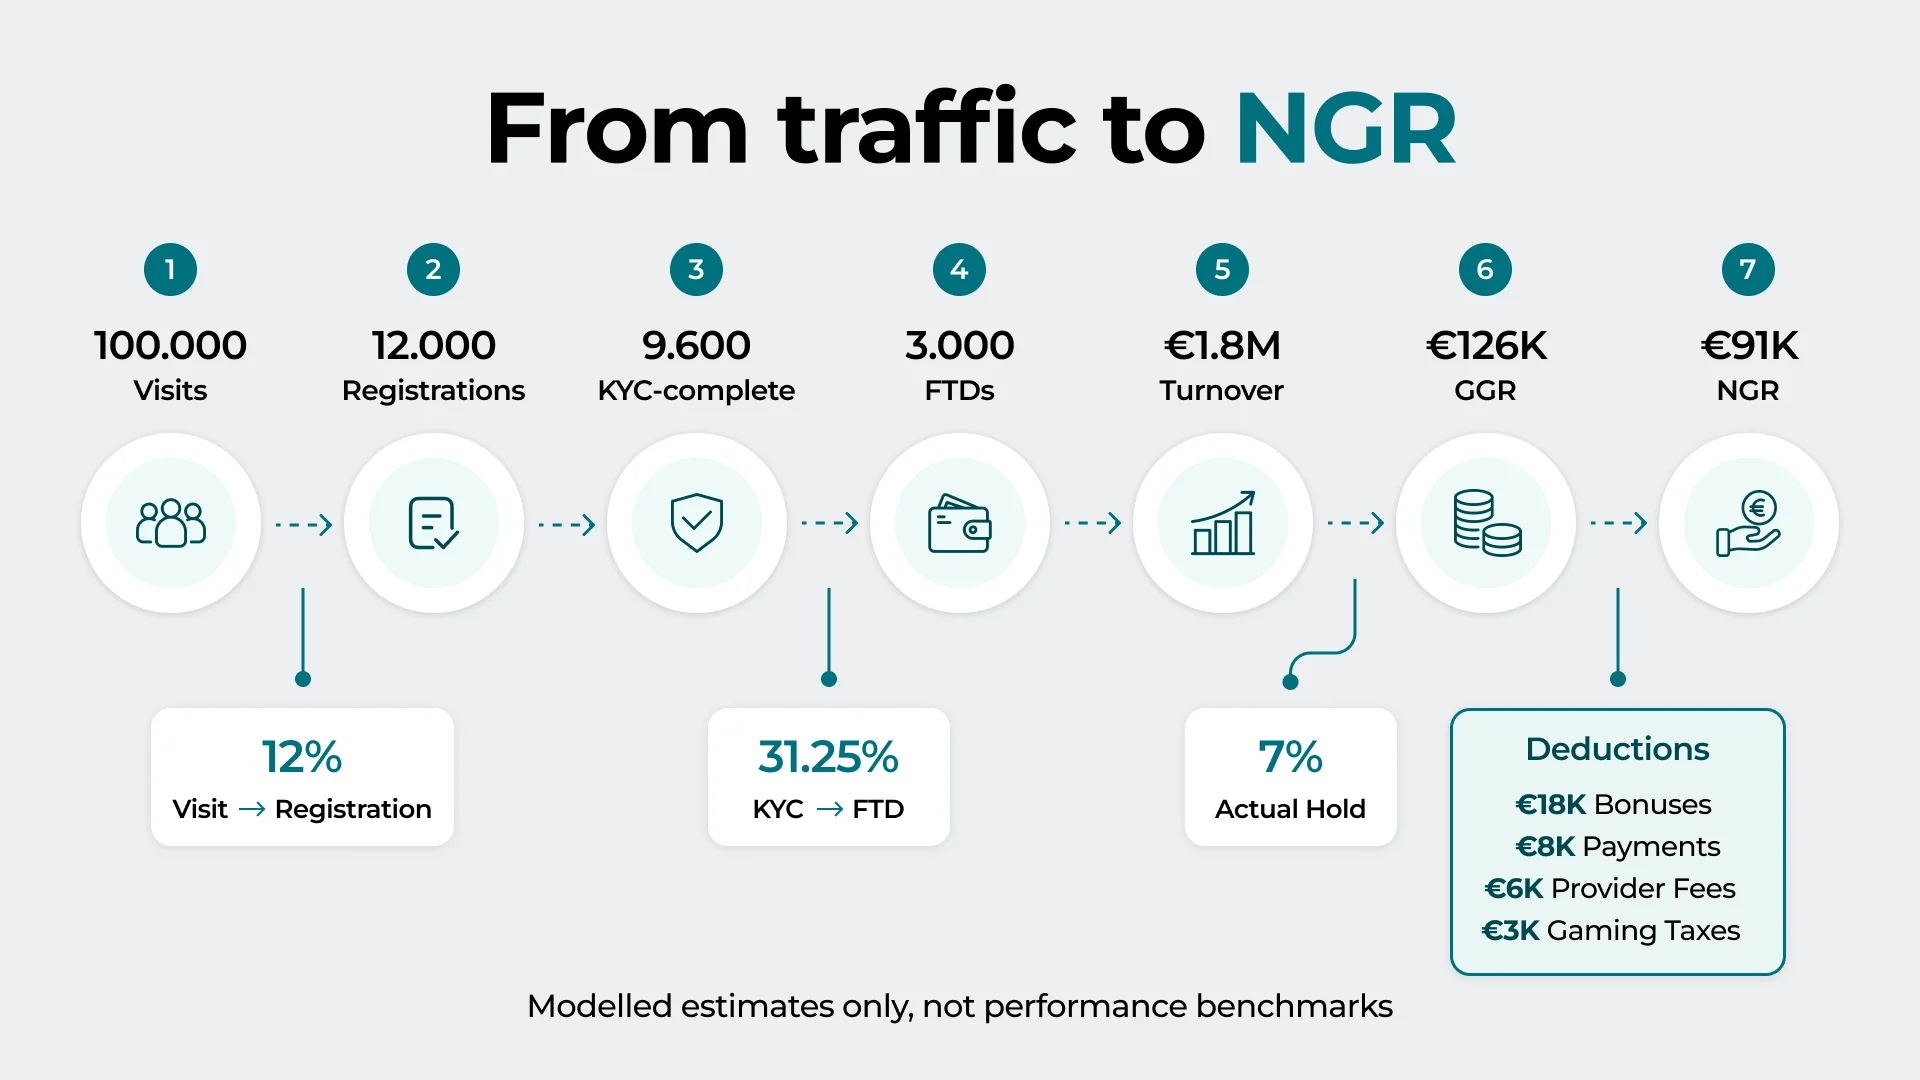
For clarity, the example below models a hypothetical funnel starting with 100,000 visits. The figures are illustrative assumptions informed by operators' practical experience and show how acquisition volume can translate into GGR and NGR.
How Acquisition KPIs Track the Path to the First Deposit
Advertising metrics such as impressions, CPM, click-through rate, CPC, and landing-page conversion are useful leading signals. They show whether the message and targeting attract attention. Commercial measurement begins further down the funnel: visit-to-registration rate, KYC completion, registration-to-first-time-depositor (FTD) rate, and cost per FTD.
Define acquisition cost around the event that matters. If "acquired" means registered rather than verified and depositing, an inexpensive channel can look efficient while delivering little value. Compare CPA or CAC with cohort-based LTV, payback period, and return on ad spend. LTV should be based on cumulative NGR or contribution margin, not deposits or turnover, and should use a consistent observation window.
Break funnel metrics down by GEO, device, campaign, affiliate, creative, and payment method. An aggregate FTD rate may hide a strong campaign offset by a mobile KYC failure. Attribution also matters: cohort reporting shows the value later generated by players acquired in a given period.
The practical acquisition question is not "How many players did we buy?" but "Which sources brought verified depositors who remained active, generated positive NGR, and stayed within the expected risk profile?"
Measuring Engagement and Retention Beyond Averages
After the first deposit, analysis shifts from acquisition to how regularly players return and how deeply they engage with the product. DAU (Daily Active Users) and MAU (Monthly Active Users) capture the size of this active audience over different time windows.
DAU/MAU is a separate stickiness ratio: it shows the share of monthly active players who are active on a given day. The ratio is meaningful only when both counts use the same definition of "active", ideally tied to a value-bearing event such as placing a real-money bet.
DAU/MAU gives a high-level view of engagement frequency. To understand what drives it, add:
- average active days per monthly active player;
- sessions per active;
- time between sessions;
- session length;
- bets per session;
- cross-product movement.
More frequent or longer play is not an automatic success. Read these signals alongside NGR, deposit behaviour, responsible gambling indicators, and player concentration. DAU/MAU describes engagement frequency; it does not replace cohort retention.
Retention is best measured by acquisition cohort. Day 1, Day 7, and Day 30 retention show early player return patterns; repeat-deposit rate and time to second deposit indicate whether activation develops. Churn, reactivation, cohort LTV, and active lifespan describe the longer curve. Define churn explicitly because "no bet for 30 days" and "no deposit for 90 days" answer different questions.
Segmentation makes these KPIs operational. Compare new, regular, VIP, bonus-led, casino, sportsbook, and at-risk groups. A blended retention rate may improve simply because the player mix changed, while retention inside each important segment deteriorated.
Payment KPIs: Revenue, Friction, and Trust
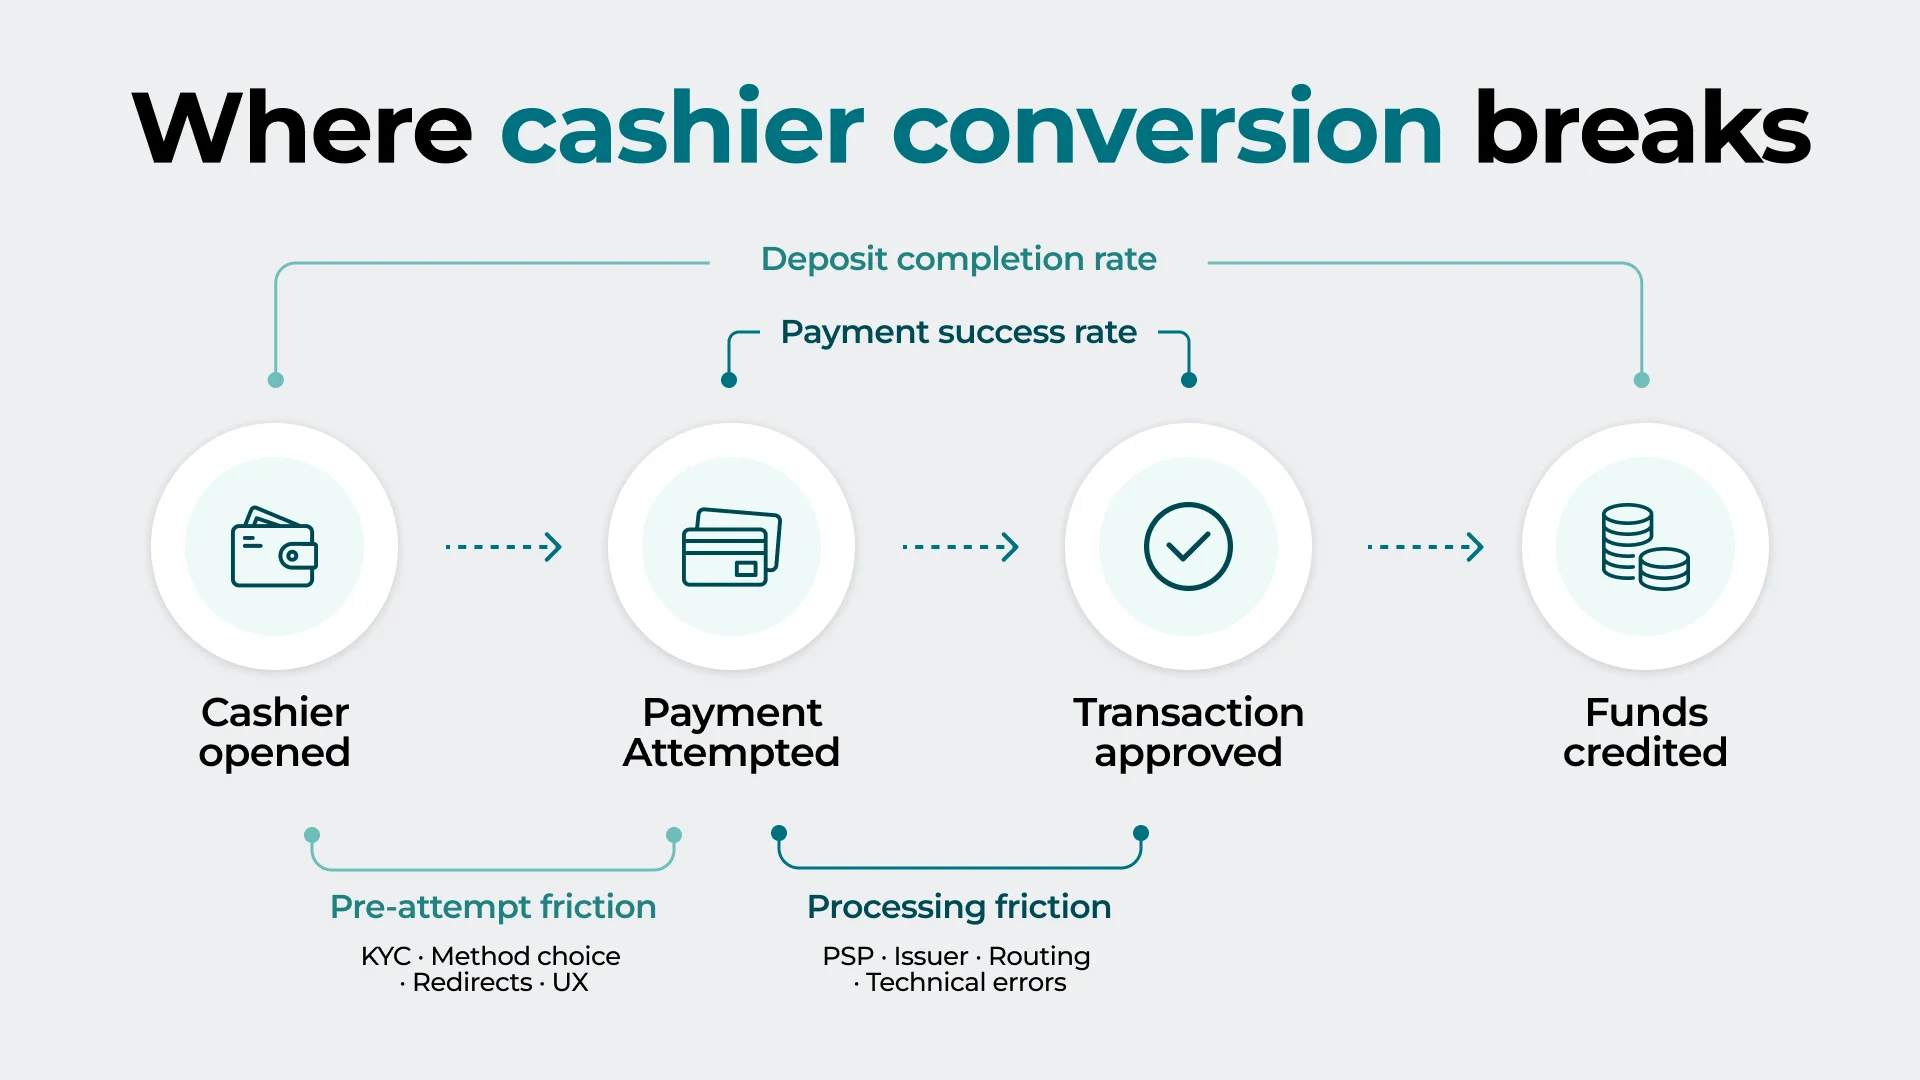
The cashier has two separate conversion points. Payment success rate measures successful transactions as a share of all attempts, while deposit completion rate measures the share of players who complete the full flow after opening the cashier. The gap between them helps locate where value is being lost: before a payment attempt or during transaction processing.
The diagram below maps both KPIs onto the same journey. It gives operators a quick way to identify the affected stage before analysing PSP, issuer, payment method, or UX data in more detail.
Track approval rates and decline reasons by PSP, method, issuer, GEO, currency, device, and segment. Add time to first deposit, processing time, method mix, average value, retries, and fee per success. For withdrawals, monitor approval and payout time, failures, cancellations, and manual-review share. Withdrawal speed is also a trust signal.
Chargeback and refund rates, fraud losses, and deposit-to-withdrawal balance complete the picture. A payment portfolio should therefore be assessed by conversion, reliability, coverage, cost, and risk together. The cheapest rail can be expensive if it declines valuable players.
What Product, Bonus, and CRM KPIs Reveal About Value
Product reporting should show GGR and NGR by vertical, provider, game, category, market, and player segment. The following metrics can show whether technical issues are suppressing commercial performance:
- game-launch success;
- error rate;
- latency;
- platform uptime.
For casino content, compare actual RTP over an appropriate sample with the certified theoretical value. For sportsbook, monitor actual hold against expected margin, trading exposure, live-betting share, voids, and settlement accuracy.
Bonuses require their own profitability chain: bonus cost, bonuses-to-GGR ratio, claim rate, activation rate, wagering completion, conversion to repeat deposit, post-promotion retention, and bonus-abuse rate. A high redemption rate says little if the same players would have deposited without the offer.
CRM campaigns should connect reach and clicks to reactivation, deposit conversion, incremental turnover and NGR, retention lift, and cost per incremental active. Holdout groups or credible baselines separate genuine uplift from activity that happened anyway.
How Risk, Compliance, and Service KPIs Protect Growth
It's important for control systems to identify risks without blocking too many legitimate players. A reliable picture emerges when the following risk and operational indicators are assessed together:
- AML alert volume;
- average open-case age;
- average case-resolution time;
- source-of-funds completion rate;
- detected fraud case volume;
- false-positive rate;
- chargeback rate;
- confirmed fraud losses.
Responsible gambling requires careful interpretation. Track limit-setting and self-exclusion use, behavioural risk flags, intervention rate, time to review, and time to apply a restriction. These are protection and governance measures, not targets to minimise. Any regulatory breach, missed SLA, or failure to honour self-exclusion should be escalated independently of revenue.
Support data adds an early-warning layer. First-response time, first-contact resolution rate, resolution time, abandonment rate, escalation rate, CSAT, and cost per contact can reveal payment, bonus, or verification problems before churn increases. A fast reply that does not solve the issue still erodes trust.
Build a KPI System That Leads to Action
Once the priority KPIs have been selected, turn them into a repeatable management process. A practical setup has four steps:
- Create a KPI register. Store the approved definition, accountable owner, and data source for each indicator in one controlled record. Version any change so historical comparisons remain valid.
- Establish internal baselines. Validate historical data to identify normal ranges and seasonality. Set thresholds using the operator's own performance and risk appetite rather than generic benchmarks.
- Set the review rhythm. Use daily checks for exceptions, weekly reviews for performance changes, and monthly analysis for longer-term economics. This prevents short-term noise from dominating decisions.
- Close the response loop. When a threshold is crossed, record the hypothesis, isolate the affected segment, assign the investigation, and document the outcome. Refine alerts that repeatedly fail to produce a useful action.
Before deciding how to respond, the initial signal still needs a diagnostic check. The five pairings below show how a second metric can confirm or challenge its interpretation before the team changes spend, product settings, or player communication.
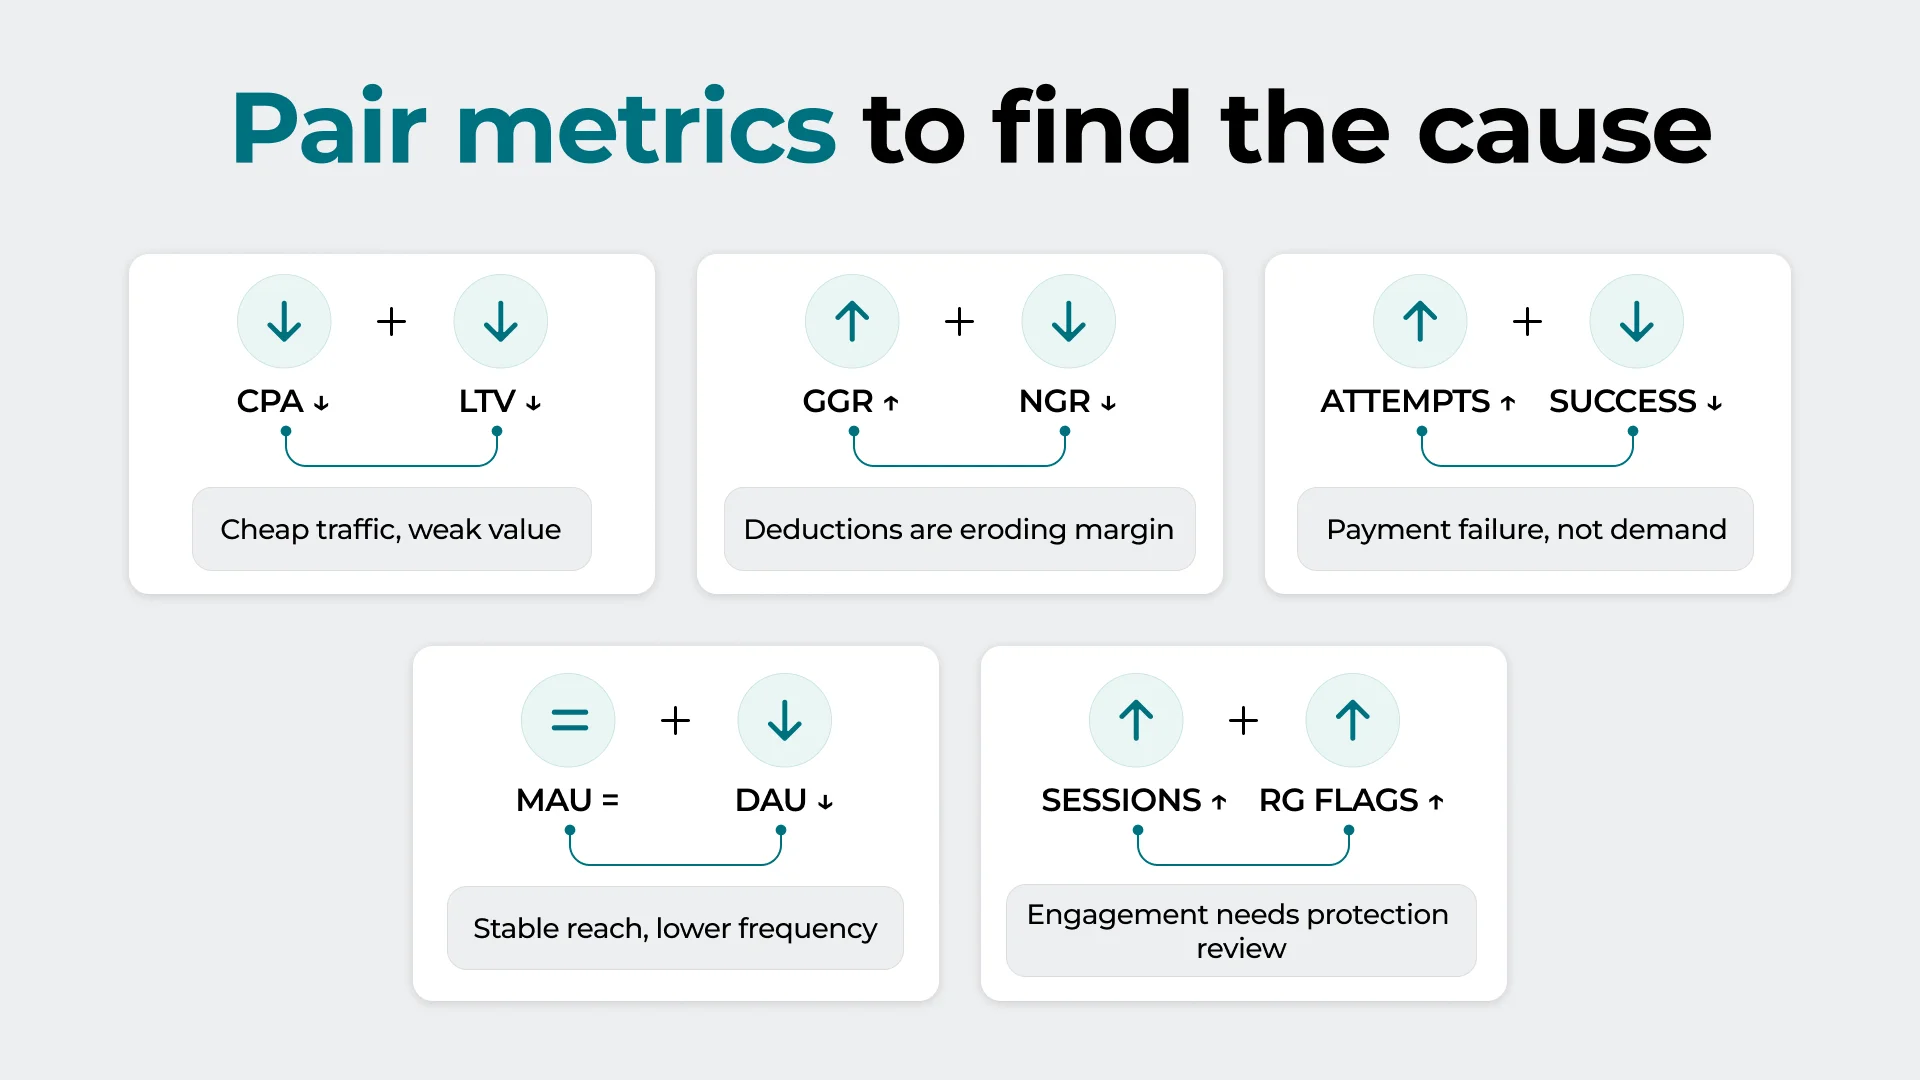
When definitions are consistent and metrics are read in context, analytics becomes more than reporting. It gives operators a practical way to allocate spend, remove friction, protect players, and scale on healthier economics.